Graphviz
👉 Graphviz ist ein Open-Source-Tool, das zur Visualisierung von Graphen und Diagrammen verwendet wird. Es ermöglicht die Darstellung von Beziehungen zwischen Knoten in einem Diagramm und ist besonders nützlich für die Darstellung von Datenstrukturen, Flussdiagrammen und anderen komplexen Beziehungen.
Die Grafiken werden in der DOT-Sprache beschrieben und anschliessend in ein SVG übersetzt.
```dot
digraph {
	rankdir=LR;
    a -> b;
    b -> c;
}
```

Optionen
Ausgabeoptionen
Der dot-Code wird als SVG ausgegeben und somit lassen sich wie bei Bildern Unterschriften und Ausgabeoptionen hinzufügen.
```dot :mdi[image]{.blue}-Beschriftung **mit** __Formatierung__ --width=500px
digraph {
	rankdir=LR;
    a -> b;
    b -> c;
}
```
Beispiele
Binärbaum
Sourcecode
```dot
digraph BinarySearchTree {
  node [shape=circle, style=filled, fillcolor=lightblue, fontname="Arial"];
  edge [fontname="Arial"];

  // Root node
  8 [fillcolor=lightgreen, label="8"];

  // Connections
  8 -> 3;
  8 -> 10;
  3 -> 1;
  3 -> 6;
  6 -> 4;
  6 -> 7;
  10 -> 9;
  10 -> 14;
  14 -> 13;

  // Node numbers indicate both value and insertion order
  1 [label="1"];
  3 [label="3"];
  4 [label="4"];
  6 [label="6"];
  7 [label="7"];
  9 [label="9"];
  10 [label="10"];
  13 [label="13"];
  14 [label="14"];
}
```

Beispiele von 👉 https://graphviz.org/gallery/
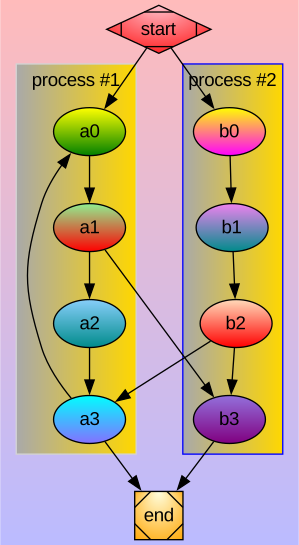
Cluster Gradients
Sourcecode
Beispiel von https://graphviz.org/Gallery/gradient/cluster.html

```dot
digraph G {bgcolor="#0000FF44:#FF000044" gradientangle=90
	fontname="Helvetica,Arial,sans-serif"
	node [fontname="Helvetica,Arial,sans-serif"]
	edge [fontname="Helvetica,Arial,sans-serif"]

	subgraph cluster_0 {
		style=filled;
		color=lightgrey;
		fillcolor="darkgray:gold";
		gradientangle=0
		node [fillcolor="yellow:green" style=filled gradientangle=270] a0;
		node [fillcolor="lightgreen:red"] a1;
		node [fillcolor="lightskyblue:darkcyan"] a2;
		node [fillcolor="cyan:lightslateblue"] a3;

		a0 -> a1 -> a2 -> a3;
		label = "process #1";
	}

	subgraph cluster_1 {
		node [fillcolor="yellow:magenta"
			 style=filled gradientangle=270] b0;
		node [fillcolor="violet:darkcyan"] b1;
		node [fillcolor="peachpuff:red"] b2;
		node [fillcolor="mediumpurple:purple"] b3;

		b0 -> b1 -> b2 -> b3;
		label = "process #2";
		color=blue
		fillcolor="darkgray:gold";
		gradientangle=0
		style=filled;
	}
	start -> a0;
	start -> b0;
	a1 -> b3;
	b2 -> a3;
	a3 -> a0;
	a3 -> end;
	b3 -> end;

	start [shape=Mdiamond ,
		fillcolor="pink:red",
		gradientangle=90,
		style=radial];
	end [shape=Msquare,
		fillcolor="lightyellow:orange",
		style=radial,
		gradientangle=90];
}
```
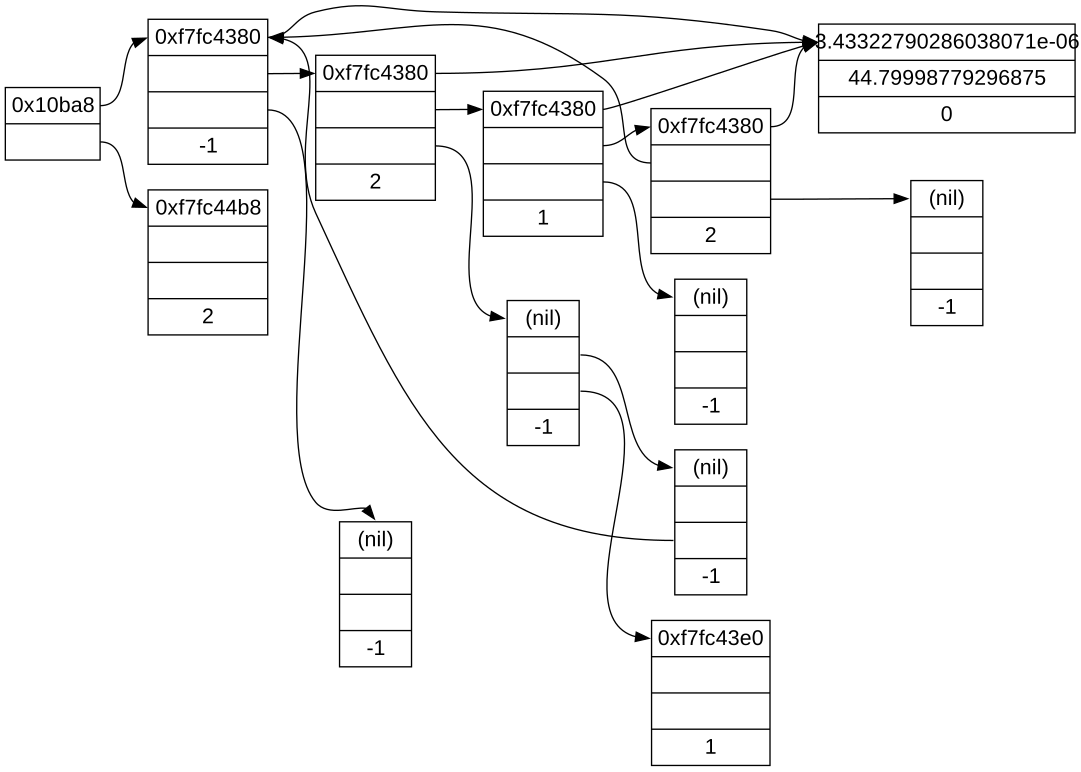
Data Structures
Sourcecode
Beispiel von https://graphviz.org/Gallery/directed/datastruct.html

```dot
digraph g {
    fontname="Helvetica,Arial,sans-serif"
    node [fontname="Helvetica,Arial,sans-serif"]
    edge [fontname="Helvetica,Arial,sans-serif"]
    graph [rankdir = "LR"];

    node [
        fontsize = "16"
        shape = "ellipse"
    ]

    edge [];

    "node0" [label = "<f0> 0x10ba8| <f1>" shape = "record"];
    "node1" [label = "<f0> 0xf7fc4380| <f1> | <f2> |-1" shape = "record"];
    "node2" [label = "<f0> 0xf7fc44b8| | |2" shape = "record"];
    "node3" [label = "<f0> 3.43322790286038071e-06|44.79998779296875|0" shape = "record"];
    "node4" [label = "<f0> 0xf7fc4380| <f1> | <f2> |2" shape = "record"];
    "node5" [label = "<f0> (nil)| | |-1" shape = "record"];
    "node6" [label = "<f0> 0xf7fc4380| <f1> | <f2> |1" shape = "record"];
    "node7" [label = "<f0> 0xf7fc4380| <f1> | <f2> |2" shape = "record"];
    "node8" [label = "<f0> (nil)| | |-1" shape = "record"];
    "node9" [label = "<f0> (nil)| | |-1" shape = "record"];
    "node10" [label = "<f0> (nil)| <f1> | <f2> |-1" shape = "record"];
    "node11" [label = "<f0> (nil)| <f1> | <f2> |-1" shape = "record"];
    "node12" [label = "<f0> 0xf7fc43e0| | |1" shape = "record"];

    // Edges
    "node0":f0 -> "node1":f0 [id = 0];
    "node0":f1 -> "node2":f0 [id = 1];
    "node1":f0 -> "node3":f0 [id = 2];
    "node1":f1 -> "node4":f0 [id = 3];
    "node1":f2 -> "node5":f0 [id = 4];

    // Node 4 edges
    "node4":f0 -> "node3":f0 [id = 5];
    "node4":f1 -> "node6":f0 [id = 6];
    "node4":f2 -> "node10":f0 [id = 7];

    // Node 6 edges
    "node6":f0 -> "node3":f0 [id = 8];
    "node6":f1 -> "node7":f0 [id = 9];
    "node6":f2 -> "node9":f0 [id = 10];

    // Node 7 edges
    "node7":f0 -> "node3":f0 [id = 11];
    "node7":f1 -> "node1":f0 [id = 12];
    "node7":f2 -> "node8":f0 [id = 13];

    // Node 10 edges
    "node10":f1 -> "node11":f0 [id = 14];
    "node10":f2 -> "node12":f0 [id = 15];

    // Node 11 edges
    "node11":f2 -> "node1":f0 [id = 16];
}
```
Partially Transparent Colors
Sourcecode
Beispiel von https://graphviz.org/Gallery/neato/transparency.html
```dot
graph Transparency {
	layout=neato
	start=11 // empiric value to set orientation
	bgcolor="#0000ff11"
	node [shape=circle width=2.22 label="" style=filled]
	5 [color="#0000ff80"]
	6 [color="#ee00ee80"]
	1 [color="#ff000080"]
	2 [color="#eeee0080"]
	3 [color="#00ff0080"]
	4 [color="#00eeee80"]
	1 -- 2 -- 3 -- 4 -- 5 -- 6 -- 1
}
```

Finite Automaton
Sourcecode
Beispiel von https://graphviz.org/Gallery/directed/fsm.html
```dot
digraph finite_state_machine {
	fontname="Helvetica,Arial,sans-serif"
	node [fontname="Helvetica,Arial,sans-serif"]
	edge [fontname="Helvetica,Arial,sans-serif"]
	rankdir=LR;
	node [shape = doublecircle]; 0 3 4 8;
	node [shape = circle];
	0 -> 2 [label = "SS(B)"];
	0 -> 1 [label = "SS(S)"];
	1 -> 3 [label = "S($end)"];
	2 -> 6 [label = "SS(b)"];
	2 -> 5 [label = "SS(a)"];
	2 -> 4 [label = "S(A)"];
	5 -> 7 [label = "S(b)"];
	5 -> 5 [label = "S(a)"];
	6 -> 6 [label = "S(b)"];
	6 -> 5 [label = "S(a)"];
	7 -> 8 [label = "S(b)"];
	7 -> 5 [label = "S(a)"];
	8 -> 6 [label = "S(b)"];
	8 -> 5 [label = "S(a)"];
}
```

Math Parse Tree
Sourcecode
Beispiel von https://graphviz.org/Gallery/directed/Genetic_Programming.html
```dot
graph {
    fontname="Helvetica,Arial,sans-serif"
    node [fontname="Helvetica,Arial,sans-serif"]
    edge [fontname="Helvetica,Arial,sans-serif"]

   n022 ;
   n022 [label="+"] ;
   n022 -- n023 ;
   n023 [label="%"] ;
   n023 -- n024 ;
   n024 [label="EXP"] ;
   n024 -- n025 ;
   n025 [label="SIN"] ;
   n025 -- n026 ;
   n026 [label="+"] ;
   n026 -- n027 ;
   n027 [label="X"] ;
   n026 -- n028 ;
   n028 [label="X"] ;
   n023 -- n029 ;
   n029 [label="SIN"] ;
   n029 -- n030 ;
   n030 [label="*"] ;
   n030 -- n031 ;
   n031 [label="X"] ;
   n030 -- n032 ;
   n032 [label="EXP"] ;
   n032 -- n033 ;
   n033 [label="*"] ;
   n033 -- n034 ;
   n034 [label="X"] ;
   n033 -- n035 ;
   n035 [label="X"] ;
   n022 -- n036 ;
   n036 [label="*"] ;
   n036 -- n037 ;
   n037 [label="X"] ;
   n036 -- n038 ;
   n038 [label="X"] ;
}
```

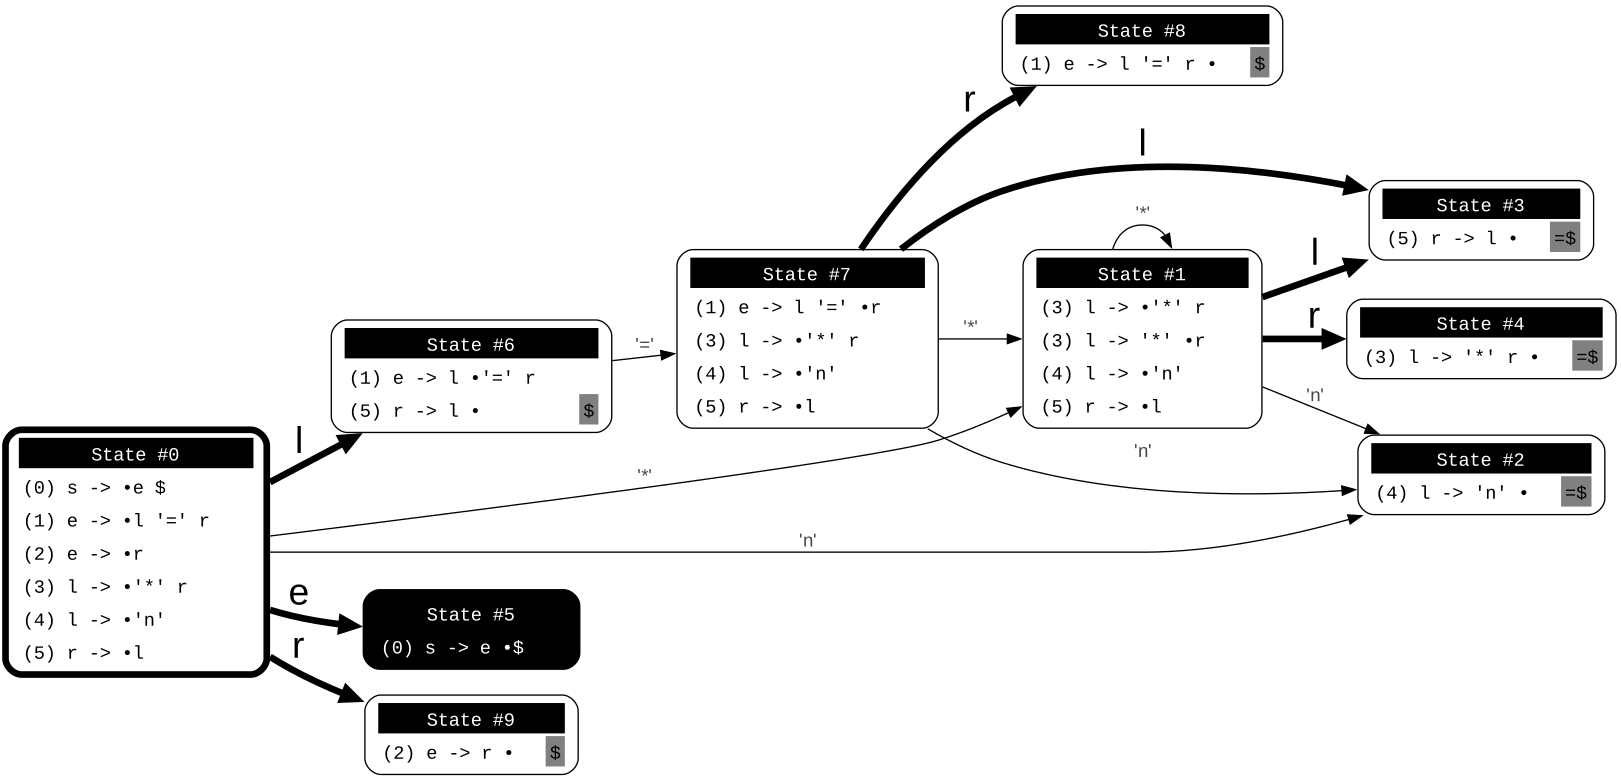
Parsing tree
Sourcecode
Beispiel von https://graphviz.org/Gallery/directed/psg.html
```dot
digraph g {
graph [rankdir=LR, fontsize=30, labelloc="t", label="", splines=true, overlap=false];
node [fontname="Helvetica,Arial,sans-serif", shape="Mrecord", fontname="Courier New"];
edge [fontname="Helvetica,Arial,sans-serif"];
ratio = auto;
// State Definitions
"state0" [style="filled, bold", penwidth=5, fillcolor="white", label=<<table border="0" cellborder="0" cellpadding="3" bgcolor="white">
<tr><td bgcolor="black" align="center" colspan="2"><font color="white">State #0</font></td></tr>
<tr><td align="left" port="r0">(0) s -> •e $ </td></tr>
<tr><td align="left" port="r1">(1) e -> •l '=' r </td></tr>
<tr><td align="left" port="r2">(2) e -> •r </td></tr>
<tr><td align="left" port="r3">(3) l -> •'*' r </td></tr>
<tr><td align="left" port="r4">(4) l -> •'n' </td></tr>
<tr><td align="left" port="r5">(5) r -> •l </td></tr>
</table>>];
"state1" [style="filled", penwidth=1, fillcolor="white", label=<<table border="0" cellborder="0" cellpadding="3" bgcolor="white">
<tr><td bgcolor="black" align="center" colspan="2"><font color="white">State #1</font></td></tr>
<tr><td align="left" port="r3">(3) l -> •'*' r </td></tr>
<tr><td align="left" port="r3">(3) l -> '*' •r </td></tr>
<tr><td align="left" port="r4">(4) l -> •'n' </td></tr>
<tr><td align="left" port="r5">(5) r -> •l </td></tr>
</table>>];
"state2" [style="filled", penwidth=1, fillcolor="white", label=<<table border="0" cellborder="0" cellpadding="3" bgcolor="white">
<tr><td bgcolor="black" align="center" colspan="2"><font color="white">State #2</font></td></tr>
<tr><td align="left" port="r4">(4) l -> 'n' •</td><td bgcolor="grey" align="right">=$</td></tr>
</table>>];
"state3" [style="filled", penwidth=1, fillcolor="white", label=<<table border="0" cellborder="0" cellpadding="3" bgcolor="white">
<tr><td bgcolor="black" align="center" colspan="2"><font color="white">State #3</font></td></tr>
<tr><td align="left" port="r5">(5) r -> l •</td><td bgcolor="grey" align="right">=$</td></tr>
</table>>];
"state4" [style="filled", penwidth=1, fillcolor="white", label=<<table border="0" cellborder="0" cellpadding="3" bgcolor="white">
<tr><td bgcolor="black" align="center" colspan="2"><font color="white">State #4</font></td></tr>
<tr><td align="left" port="r3">(3) l -> '*' r •</td><td bgcolor="grey" align="right">=$</td></tr>
</table>>];
"state5" [style="filled", penwidth=1, fillcolor="black", label=<<table border="0" cellborder="0" cellpadding="3" bgcolor="black">
<tr><td bgcolor="black" align="center" colspan="2"><font color="white">State #5</font></td></tr>
<tr><td align="left" port="r0"><font color="white">(0) s -> e •$ </font></td></tr>
</table>>];
"state6" [style="filled", penwidth=1, fillcolor="white", label=<<table border="0" cellborder="0" cellpadding="3" bgcolor="white">
<tr><td bgcolor="black" align="center" colspan="2"><font color="white">State #6</font></td></tr>
<tr><td align="left" port="r1">(1) e -> l •'=' r </td></tr>
<tr><td align="left" port="r5">(5) r -> l •</td><td bgcolor="grey" align="right">$</td></tr>
</table>>];
"state7" [style="filled", penwidth=1, fillcolor="white", label=<<table border="0" cellborder="0" cellpadding="3" bgcolor="white">
<tr><td bgcolor="black" align="center" colspan="2"><font color="white">State #7</font></td></tr>
<tr><td align="left" port="r1">(1) e -> l '=' •r </td></tr>
<tr><td align="left" port="r3">(3) l -> •'*' r </td></tr>
<tr><td align="left" port="r4">(4) l -> •'n' </td></tr>
<tr><td align="left" port="r5">(5) r -> •l </td></tr>
</table>>];
"state8" [style="filled", penwidth=1, fillcolor="white", label=<<table border="0" cellborder="0" cellpadding="3" bgcolor="white">
<tr><td bgcolor="black" align="center" colspan="2"><font color="white">State #8</font></td></tr>
<tr><td align="left" port="r1">(1) e -> l '=' r •</td><td bgcolor="grey" align="right">$</td></tr>
</table>>];
"state9" [style="filled", penwidth=1, fillcolor="white", label=<<table border="0" cellborder="0" cellpadding="3" bgcolor="white">
<tr><td bgcolor="black" align="center" colspan="2"><font color="white">State #9</font></td></tr>
<tr><td align="left" port="r2">(2) e -> r •</td><td bgcolor="grey" align="right">$</td></tr>
</table>>];
// State Transitions
state0 -> state5 [penwidth=5, fontsize=28, fontcolor="black", label="e"];
state0 -> state6 [penwidth=5, fontsize=28, fontcolor="black", label="l"];
state0 -> state9 [penwidth=5, fontsize=28, fontcolor="black", label="r"];
state0 -> state1 [penwidth=1, fontsize=14, fontcolor="grey28", label="'*'"];
state0 -> state2 [penwidth=1, fontsize=14, fontcolor="grey28", label="'n'"];
state1 -> state1 [penwidth=1, fontsize=14, fontcolor="grey28", label="'*'"];
state1 -> state4 [penwidth=5, fontsize=28, fontcolor="black", label="r"];
state1 -> state2 [penwidth=1, fontsize=14, fontcolor="grey28", label="'n'"];
state1 -> state3 [penwidth=5, fontsize=28, fontcolor="black", label="l"];
state6 -> state7 [penwidth=1, fontsize=14, fontcolor="grey28", label="'='"];
state7 -> state8 [penwidth=5, fontsize=28, fontcolor="black", label="r"];
state7 -> state1 [penwidth=1, fontsize=14, fontcolor="grey28", label="'*'"];
state7 -> state2 [penwidth=1, fontsize=14, fontcolor="grey28", label="'n'"];
state7 -> state3 [penwidth=5, fontsize=28, fontcolor="black", label="l"];
}
```
Funtionsweise
Remark prozessiert die Markdown-Dateien während dem Build-Prozess. Die dot-Blöcke werden in SVG umgewandelt und als Bilder in die Markdown-Datei eingebettet. Die SVG-Bilder für ein Dokument (bspw. für index.mdx) werden im Ordner images/.dot/datei-name abgespeichert (z.B. images/.dot/index-mdx/dot-001.svg). Die SVG Bilder müssen nicht in git eingecheckt werden, weshalb standardmässig ein .gitignore-Eintrag in den Ausgabeordnern hinzugefügt wird.
Installation
packages/remark-graphviz
Danach yarn install ausführen.
import graphvizPlugin from '@tdev/remark-graphviz/remark-plugin';

const getSiteConfig: SiteConfigProvider = () => {
    return {
        beforeDefaultRemarkPlugins: [
            /* ... */
            // graphvizPlugin must come before imagePlugin!
            graphvizPlugin,
            imagePlugin
        ],
    };
};
Ausgabe-Ordner images/.dot ändern
images/.dot ändernSoll der Standard-Ordner für die generierten SVG-Bilder geändert werden, kann dies in der Konfiguration des Plugins gemacht werden. Der Standard-Ordner ist images/.dot.
Anpassung zu img/.dot:
const getSiteConfig: SiteConfigProvider = () => {
    return {
        beforeDefaultRemarkPlugins: [
            /* ... */
            [
                graphvizPlugin,
                {
                    dotFileRootDir: 'img/.dot',
                }
            ]
        ]
    };
};